Identify Important Market Higher Time Frame Levels. Discover M15 Fair Value Gaps. Make Better Trading Decisions.
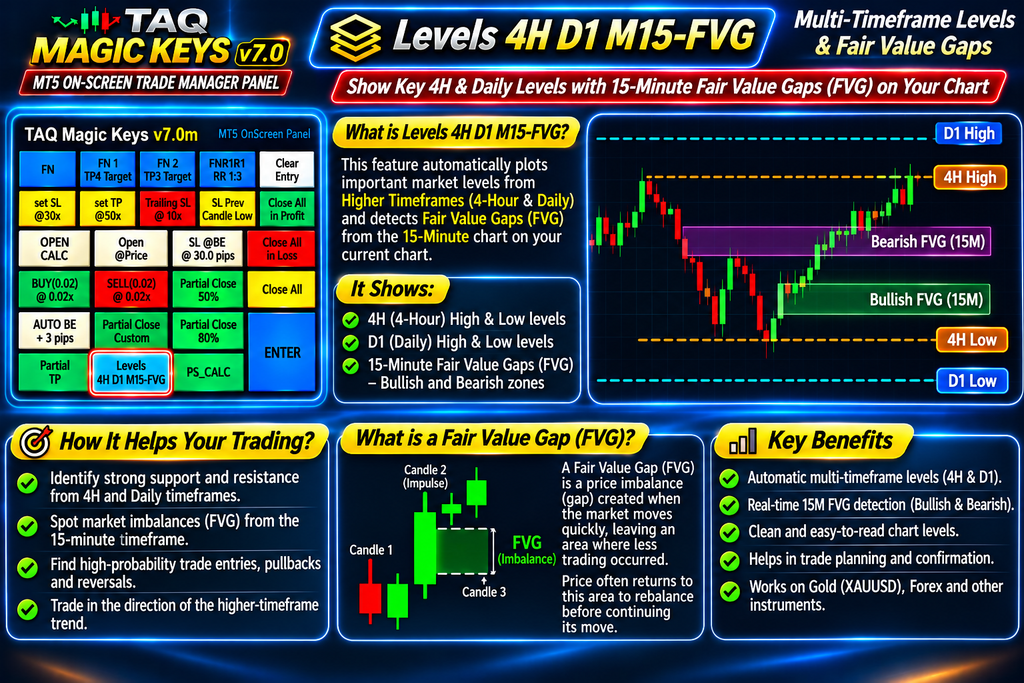
The Levels feature in TAQ Magic Keys v7.0 is a chart-analysis tool that automatically displays important higher-timeframe candle High/Low levels and 15-minute Fair Value Gaps (FVGs) directly on your MT5 chart.
It helps traders identify potential support and resistance areas, liquidity levels, and market imbalances without manually drawing these levels.
What Does the Levels Feature Display?
1. 4H Candle High & Low Levels
Displays the High and Low levels of historical 4-hour candles.
- Identify important 4H support and resistance levels.
- Monitor previous candle highs and lows.
- Use these levels to identify potential breakout and rejection areas.
- Levels stop extending when a completed chart-timeframe candle closes beyond them.
4H levels are displayed in Deep Sky Blue.
2. Daily (D1) Candle High & Low Levels
Displays the High and Low levels of historical Daily candles.
- Identify important daily market boundaries.
- Monitor previous Daily candle highs and lows.
- Find potential reaction and breakout zones.
- Levels stop extending after a completed chart-timeframe candle closes beyond the level.
Daily levels are displayed in Dark Orange.
3. M15 Fair Value Gap (FVG)
Automatically detects bullish and bearish Fair Value Gaps using three consecutive completed 15-minute candles.
- Bullish FVG: When the third candle’s Low is above the first candle’s High.
- Bearish FVG: When the third candle’s High is below the first candle’s Low.
These zones highlight price imbalances that traders may monitor for potential retracements and reactions.
How to Use the Levels Feature
Step 1 – Open Levels
Click the Levels 4H D1 M15-FVG button on the TAQ Magic Keys panel.
A small settings window appears on your chart.
Step 2 – Enable or Disable Levels
You can independently control:
- Master Levels ON/OFF
- 4H Levels ON/OFF
- Daily Levels ON/OFF
- M15 FVG ON/OFF
This allows you to display only the information you need.
Step 3 – Automatic Chart Updates
The EA scans the historical data and rebuilds the levels when a new chart candle begins.
Default historical coverage:
- 30 closed 4H candles.
- 30 closed Daily candles.
- 100 previous M15 candles for FVG detection.
Step 4 – Monitor Price Reactions
Use the displayed levels and FVG zones to study market structure, possible support and resistance, breakouts, and potential retracement areas.
Important FVG Mitigation Logic
The feature uses candle-close confirmation rather than wick touches:
- Bullish FVG: the zone is considered mitigated when a completed chart candle closes below its lower boundary.
- Bearish FVG: the zone is considered mitigated when a completed chart candle closes above its upper boundary.
A wick touching the zone does not remove it. This helps retain zones until the defined closing condition occurs.
Key Benefits
- Automatically identifies important higher-timeframe levels.
- Displays historical 4H and Daily candle boundaries.
- Detects bullish and bearish 15-minute imbalances.
- Keeps levels until the defined candle-close mitigation condition.
- Allows independent control of each display.
- Helps traders analyze especially Gold (XAUUSD), Forex and other instruments.